Answers at the Speed of Business: How Irrational Agency Delivers Rich Data for Ongoing Exploration
 Irrational Agency
One of the recurring challenges in consumer insights research is guessing in advance which questions you will want to ask. Nothing worse than finishing fieldwork, and two weeks later thinking “if only we had thought to ask them [something very obvious in hindsight]…”
The attempt to avoid this often leads researchers to cram dozens of screening and attitude questions into a survey – just in case someone needs to know it one day. Many pages of screening and usage questions become annoying for the respondent, and make producing and analyzing the data time-consuming and laborious. Data quality is lost because you can no longer see the wood for the trees.
It’s worse, though, when you didn’t ask the question at all. Then you simply can’t answer questions like “Does Gen Z think our brand is sustainable?” or “Would high-income customers be willing to pay for a premium version?” Your insight team will tell you – we don’t have the data, we need more budget. So you spend more money, and more time, to go back into field and ask again. Instead of having the answers at your fingertips when you need them, they arrive a month late, and $50,000 down.
What if, instead, there was a way to gather a wide range of behavioral data, consumer attitudes, emotions and beliefs in advance, and then figure out the questions afterwards? That’s what one client, a global snacks and beverages maker, has been able to do using Irrational Agency’s System 3 data.
System 3 doesn’t ask traditional questions. Instead, this innovative research approach works by gathering thousands of stories from customers and building a rich map of associations between words, concepts and brands. This complex map represents the consumer’s “category mindset” – the topics, ideas and needs they are thinking about when they make decisions in your product category. It captures all sorts of associations and thoughts that customers might have – without you having to ask them overtly.
This map gives you a very powerful capability: the ability to ask questions of the data, without knowing in advance what they will be. When you need to make a business decision, you can dive into the System 3 map in real time and find out what it says. The map will give you an answer to your question, and point you to actionable insights to resolve your business challenge.
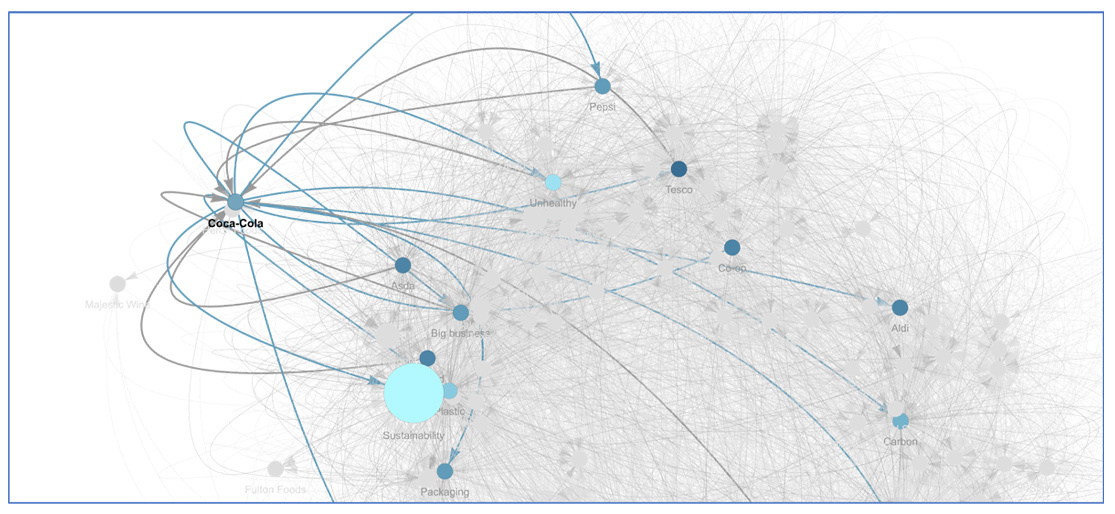
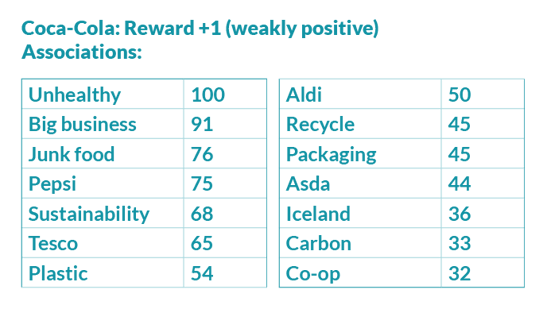
Let’s say you want to know about the sustainability perceptions of your brand. You can locate the brand within the map, and find out what words and phrases your customers associated with it. Filter the responses to Gen Z, or affluent professionals, or customers in Spain – and learn what they had to say. 16% linked the words ‘sustainable’, ‘green’ or ‘eco-friendly’ to your brand – is that good or bad? Now look at your competitor brands and find out the equivalent percentage for them. If they only scored 12%, you’re doing well. Example: Sustainability associations for Coca-Cola. “Big business”, “Packaging”, “Carbon” and “Plastic” are all visibly linked with this brand. A detailed table is shown below.
Coca-Cola: Reward +1 (weakly positive)
Associations:

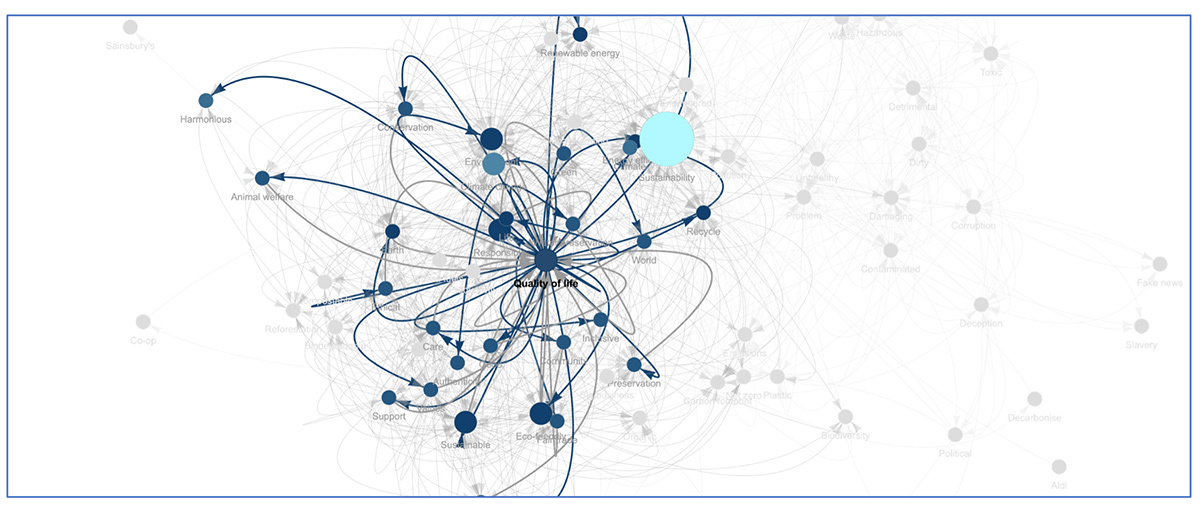
Next you have a question about premiumization or quality? Look at the words ‘premium’, ‘expensive’, ‘quality’ and anything else in the same conceptual cluster. Find out what associations those words have within your category, which brands live closest to those concepts, and how you can activate them.
 Example: Associations with ‘Quality of life’ in the same Sustainability data.
All of this in a real-time portal that you and your insight team can access directly – or with the help of your research agency, if you prefer. The portal is easy to use with about half an hour’s training and a little practice. And once you have the tool, you can spend as much or as little time as you want, navigating around and finding new insights and ideas for future exploration.
Sometimes, the map might provide a hint of the answer but you’d like more detail. Let’s say you need to understand the emotions evoked by international travel in a time of global conflict, and how those relate to your brands. Then you can top up the data by quickly putting into field a small number of extra scenarios tailored to that topic. New respondents (profile-matched to your existing sample) will provide stories and associations specific to the subject you’re exploring. Within a few days the new data can be combined with your existing map, enriching it and providing more detail on the new topic – which in turn connects back to everything you already know.
Over time, your System 3 data portal will develop into a unique, rich store of insight specific to your brands and categories – able to give quick answers to many research questions and business challenges that might have previously been impossible to solve.
Curious to hear more about Behavioral Market Research?


